scout guide columbus

Real Estate Review: Happy Holidays!

I hope everyone had a wonderful Christmas and holiday season! I have had so much fun celebrating all over Columbus with many different people. It's an exciting time to cherish, enjoy, reflect and plan for a new year. I'm so grateful to everyone who has supported me in my real estate career as friends, mentors, clients, co-ops, vendors and more. I got to celebrate my first Christmas at my new home in Clintonville and are excited for many more. My buyers who purchased a home this year got their 2017 ornaments and I gave out my Pinterest inspired EOS holiday cards all over!

2017 was such a strong seller's market and with inventory still being low not much has changed this year. The buyers who were patient, strategic and kept trying have seen that pay off getting into homes towards the end of the year when the market calmed down some. Don't forget the buyer's agent commission is paid through the listing agent so in most scenarios there is no cost to you to have representation!

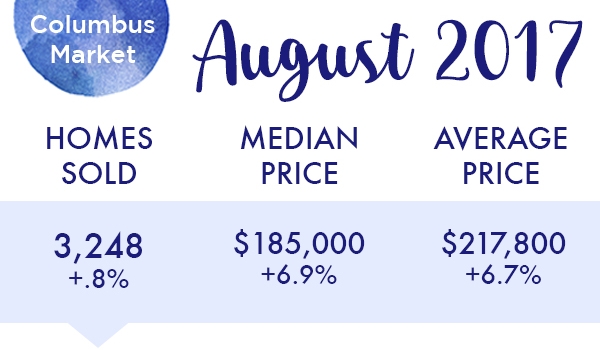
If you thought of selling in 2017 and weren't ready, I would highly encourage getting in touch so I can do a custom analysis of what your home should be worth in the 2018 market. Inventory is still low and buyers are waiting to see what will hit the market in the new year. Below are the statistics for October & November 2017. If you have questions about your specific area or neighborhood I can always run custom searches - pfjohnson@kw.com 614.638.5817

nationalstats.jpg

Here are the national real estate statistics for October & November 2017:

In October, the national median home price decreased 1.8% to $253,500, but that is up 5.6% from October 2016. In November, projected homes sales rose to 5.5 million and national median home price dipped to $245,100 down 3.2% from October, but up 4.2% from November 2017. The national average for a 30 year fixed rate mortgage decreased to 3.83% in October but rose to 3.88% in November. For specific questions on how these statistics affect you, please get in touch with me - pfjohnson@kw.com | 614.638.5817

ColumbusMarket.jpg

There were 2760 homes and condos sold during the month of October, which is a 4.4 percent increase over the same month a year ago, although a decline of 2.4 percent from September. This is the highest number of sales on record for the month of October, according to the Columbus REALTORS® Multiple Listing Service.

Buyers are pouncing on any and all inventory available that is priced correctly,” said Mic Gordon. “The central Ohio housing market continues to be hotter and stronger than ever!”
— 2017 Columbus REALTORS® President Mic Gordon

Homes spent an average of 32 days on the market during the month of October, which is three days more than September and five days fewer than October 2016.

There were 2,914 central Ohio homes and condos listed during the month of October, a 2.4 percent increase over the same month a year ago, although down 4.4 percent from September.

This left inventory at 5,131, which is down 5.8 percent from the previous month and 14 percent from October 2016. This is the 81st consecutive month of year over year declines in inventory.

Even though there were more listings added to the market in October, inventory remains extremely low,” Gordon said. “The best time to put your home on the market is now, especially since buyers are more eager than ever for inventory.

The average sales price of home during the month of October in central Ohio was $215,296, which is 7.9 percent more than October 2016. The median sales price was $183,000, up 8.9 percent from a year ago. Year to date (January through October) the average sales price is the highest on record.

“With sales prices being what they are, I hope that potential sellers realize what a tremendous time it is to list their home and take advantage of this strong seller's market,” Gordon said.

october.jpg

There were 2,377 homes and condos sold during the month of November in central Ohio, which is a 3.2 percent increase over the same month a year ago, although a decline of 13.9 percent from October. This is the highest number of sales on record for the month of November, according to the Columbus REALTORS® Multiple Listing Service.

Headed into the end of the year, we’re on track for a historic record number of closed sales,” said Mic Gordon. “Many buyers remain actively engaged in their home searches and its paying off for them!
— 2017 Columbus REALTORS® President Mic Gordon

Homes spent an average of 36 days on the market during the month of November, which is four days more than October, but six days fewer than November 2016.
 
The average sales price of a home during the month of November in central Ohio was $213,962, which is 7.6 percent more than the same month a year ago. The median sales price was $180,000, up 5.0 percent from a year ago.

Sales prices continue to be strong and steady here in central Ohio and are a solid indicator that now is as good of a time as ever to put your home on the market,” Gordon said.

There were 2,101 central Ohio homes and condos listed during the month of November, a 4.8 percent decline from November 2016 and 27.9 percent lower than the previous month. 
 
This left inventory at 4,588 at the end of November, down 15.0 percent from November 2016. This marks the 82nd consecutive month of year over year declines in inventory.

There were 2,827 homes and condos sold during the month of September, which is a 4.4 percent decrease from the same month a year ago. Year-to-date, central Ohio is still on track for a record year in home sales, according to the Columbus REALTORS® Multiple Listing Service.

It’s not unusual for this time of year that inventory is low,” Gordon said. “However, with the demand we have now, I hope that sellers take advantage of current market conditions and put their home on the market!
— 2017 Columbus REALTORS® President Mic Gordon.
November.jpg

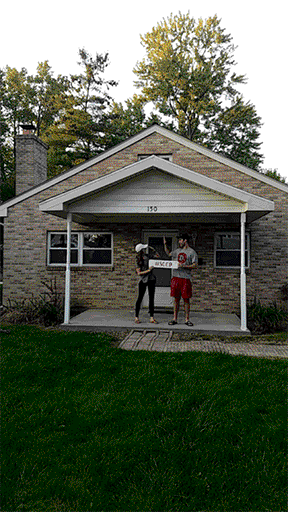
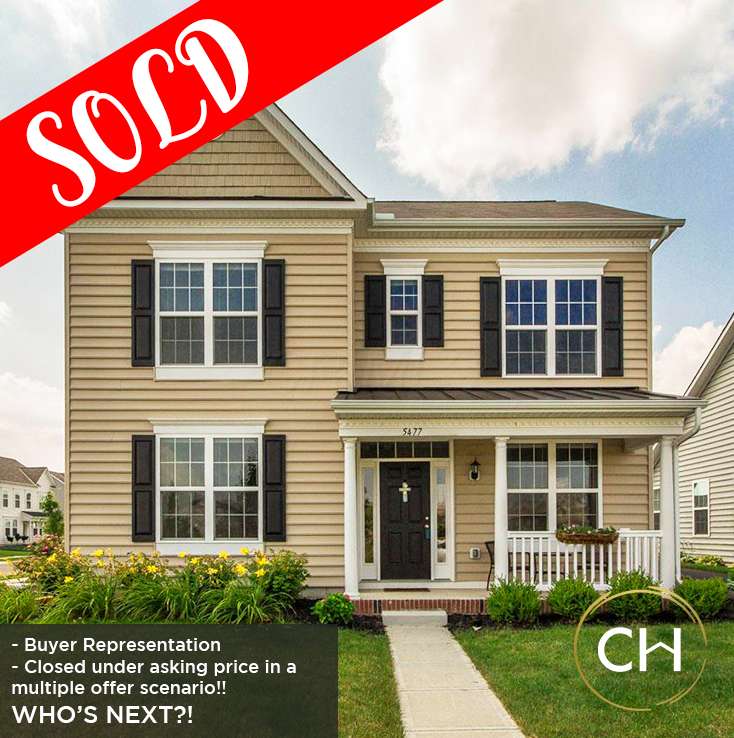
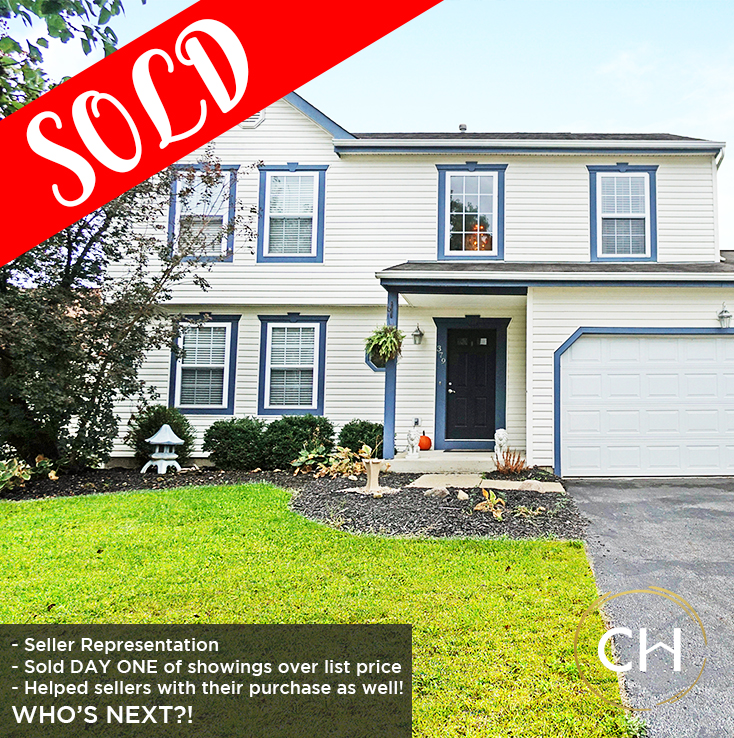
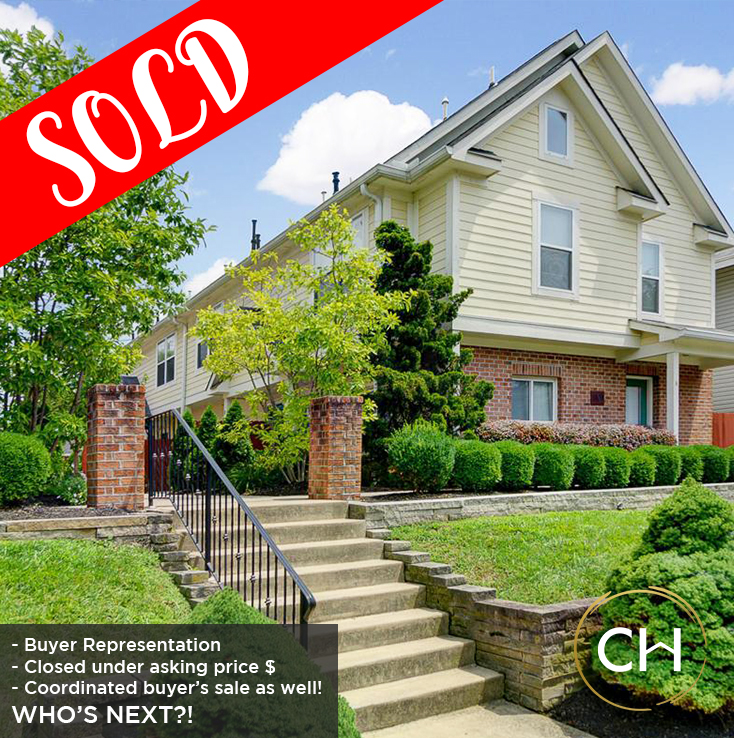
Congrats to my clients who bought and sold in October & November! Stay tuned for updates on the Clintonville Flip House or follow my Instagram story @columbesthomes 


Article shared and all information sourced via the Columbus Board of Realtors. To view the original and for more info see below: 

Current housing report – November 2017 All housing reports

Real Estate Review: Fall 2017

As fall comes to a close and temperatures drop, the market in Columbus is still warm! With low inventory and high demand, once an appealing home hits the market with the right agent, buyers are jumping!

maxrenee2.gif

Buyers who are willing to get their hands a little dirty are winning right now. I have local lenders with great renovation loans for people who are credit rich but cash poor and have the fixer upper bug! I love seeing my client's homes after they close and what they've been able to do to update the space and make it their own. Stay tuned for a renovation feature coming soon!

On the sell side, if you have an updated home or are willing to do some work pre-listing - the move in ready homes are still flying off the market! My sellers in South Columbus did a wonderful job redoing their kitchen, updating the finished basement and decorating to make buyers drool. They enjoyed their beautiful home for a few years and when they decided to list a few weeks ago after working with me to find a great condo in the Short North, they had over 16 showings and 7 offers by midnight on the first day. Both homes should be closing next month, they'll sell first so they can use the funds to purchase their new home and we negotiated post closing possession so they only need to move once! Have questions about buying and selling at the same time?

Please reach out so we can chat 614.638.5817 pfjohnson@kw.com

nationalstats.jpg

Here are the national real estate statistics for August & September 2017:

In August, the national median home price increased 4.5% to $263,800, but decreased 1.9% in September to $258,000 which still is up 6.2% from September 2016. The national average for a 30 year fixed rate mortgage rose .02% to 3.96% in August. However, it dropped to 3.86% in September which is an amazing incentive to buy in this seller's market! For specific questions on how these statistics affect you, please get in touch with me - pfjohnson@kw.com | 614.638.5817

ColumbusMarket.jpg

Homes spent an average of 27 days on the market during the month of August, which is one day less than July and eight days fewer than August 2016. This is yet another record low for central Ohio, according to the Columbus REALTORS® Multiple Listing Service.

Homes have been selling in less than a month this summer” said Mic Gordon “This is the fastest they’ve ever sold as buyers are wasting no time seizing an opportunity to purchase a home.
— 2017 Columbus REALTORS® President Mic Gordon

There were 3,248 central Ohio homes and condos sold during the month of August, which is a 5.6 percent increase over July, but less than one percent higher than a year ago. However, the homes sold year to date (21, 623) is sitting at a record high for the first eight months of the year.

There were 3,740 central Ohio homes and condos listed during the month of August, a 10 percent increase from a year ago and the highest number of new listings for the month of August since 2008. Even with the added listings, this left inventory at 5,444, which is just slightly less than the previous month and 13.2 percent below August 2016.

Homeowners today know it’s a great time to sell a home and there’s still a shortage of inventory,” Gordon said. “We’re hoping the supply increases this fall to meet the pent-up demand.

The average sales price of home during the month of August in central Ohio was $217,800, which is 6.7 percent more than August of 2016. The median sales price was $185,000, up 6.9 percent from a year ago. Year to date (January through August), both the average sales price ($215,650) and median sales price ($182,000) are the highest on record.

There were 2,827 homes and condos sold during the month of September, which is a 4.4 percent decrease from the same month a year ago. Year-to-date, central Ohio is still on track for a record year in home sales, according to the Columbus REALTORS® Multiple Listing Service.

Although there was a slight decrease in sales this past month, overall demand for homes in central Ohio continues to soar,” said Mic Gordon. “Buyers are still hungry for inventory, making it a better time than ever to sell!
— 2017 Columbus REALTORS® President Mic Gordon.

Compared to a year ago, there was a slight uptick (2.5 percent) in the number of homes listed for sale in September. This left inventory at 5,448, which is just 4 homes more than August, but 11.1 percent down from September 2016. The average sales price for the month of September in central Ohio was $212,916, which is 4.3 percent higher than the same month last year. The median sales price was $180,000, up 5.3 percent from last year.

Given that September marked our 80th consecutive month of year over year inventory decreases, it’s a positive sign that inventory didn’t decrease last month,” Gordon said. “More central Ohio home owners have realized it’s an opportune time to put their home on the market.

Homes spent an average of 29 days on the market during the month of September, which is 6 days fewer than a year ago. According to the latest Housing Market Confidence Index by the Ohio Association of REALTORS®, 84 percent of central Ohio REALTORS® expect prices to rise over the next year, while 14 percent expect prices to level. When asked about whether they’ve seen an increase or decrease in multiple offers over the past year, 84 percent said they saw they saw an increase, 14 percent said it remained the same and 2 percent said they saw a decrease.
 

infographicSept.jpg

Huge congratulations to Abigail Fredelake for The Scout Guide Columbus Volume 2!

I'm thrilled to be included among so many great businesses and people from our amazing city - browse it online or grab a copy at any of the participating locations http://thescoutguide.com/columbus/


Article shared and all information sourced via the Columbus Board of Realtors. To view the original and for more info see below: 

Current housing report – August Current housing report – September 2017 All housing reports